Activity plans
M20Applies to the
Mars 2020 ANMERApplies to the
MER ANMSLApplies to the
MSL ANPHXApplies to the
PHX AN
Because Mars is too far from Earth to support real-time commanding of the landed craft, the science team regularly sends a plan of activities spanning one or more sols for automated execution. A simplified version of activity plans is presented in the Notebook for MER, MSL, and Mars 2020 rovers. Note that some plans include activities for more than one sol. Later in mission life, as operations knowledge increases and budgets decrease, the science team may meet less frequently and send multi-sol plans to the rover or lander. The Notebook attaches these multi-sol plans to the beginning sol in the range.
Plans are easily accessed from the So summaries tab. They appear in list or timeline form, depending on the mission.
| Mission | Landed craft | Activity plan view(s) available |
|---|---|---|
| M20Applies to the Mars 2020 AN |
Perseverance | Timeline view |
| MERApplies to the MER AN |
Opportunity and Spirit | List view |
| MSLApplies to the MSL AN |
Curiosity | List and Timeline views |
| PHXApplies to the PHX AN |
Phoenix | Not currently available |
What plans can tell you—and what they can't
Looking through activity plans can be fun, even for non-scientists. You might find a command telling a rover to wake up or find the sun. Other commands tell instruments to make an observation or prepare to transmit data back to Earth. Some commands are for housekeeping tasks or health measures like survival heating.
No matter what commands are delivered, the plan you see in the Notebook is the plan that was expected to run. Things don't always go according to plan:
- Events might cause some or all of the plan to not execute, such as a communications or system fault.
- Sometimes the science team's activity plan is tweaked by engineers just before it is sent to Mars. For example, a command to place an instrument on or near a particular location might be altered slightly if the arm cannot reach (or it is not safe to try reaching) the requested spot.
- The start and end times for an activity might be slightly different from the actual time of execution. For observations that resulted in archived data, use the times in the metadata label rather than the activity plan.
The takeaway here is that the plans tell us what the science team intended for in situ operations, but do not tell us which commanded activities actually completed. The "as run" results generally follow the plan you see.
Activity details
You can imagine that science plans for autonomous operations on another planet will be complex. The Notebook includes only limited details of each activity from the full plan. The MER plan list view shows details within the list. Activity details for other missions are displayed when an activity is selected. The details view usually show a high level overview of an activity, including name, start and end times, and notes. Data products known to be associated with the activity are shown, and clicking on the product will open it in the Notebook. Some activity properties and arguments may be shown.
Finding data related to a specific activity
Linking planned activities to resulting archive data is not as robust as we would like. Newer missions have placed more emphasis on "round trip tracking" to support connections between the plan and the data, yet inconsistencies remain. Where known, the Notebook includes links from activities to data. For MER and MSL we use a combination of the activity sequence ID and planned start time to find matching data products. The Mars 2020 team provides round trip tracking markers for some data.
Using the timeline view
Timeline views can be complex. Be prepared to wait a moment or two when opening the plans as some cover multiple sols, and your browser will need some time to draw the timeline. A toolbar at the top of the timeline includes controls for modifying the grid interval and sizing. The timeline view for the missions behaves differently as discussed next.
MISSION SPECIFIC
The time span of the merge set encompasses all of the activity groups on the timeline. You can collapse and expand merge sets and activity groups by clicking on the arrow icons to the left of the name.
Time values in the timeline
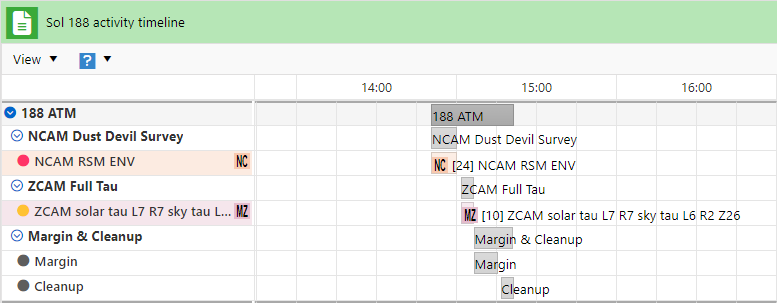
The M20 plan timeline shows the planned activity start and end times in local true solar time (LTST) relative to the Mars rover on the given sol. As mentioned above, these times are when activities were expected to run and may not reflect an actual completed activity on Mars.
Moving through the timeline
Scroll horizontally and vertically through the timeline to view activities. Use your mouse wheel to scroll vertically (your cursor must be over the timeline grid and not over the left-hand column of titles). Clicking on a name in the left-hand column will scroll the grid entry into view if it is not already visible.
Accessing details and related data
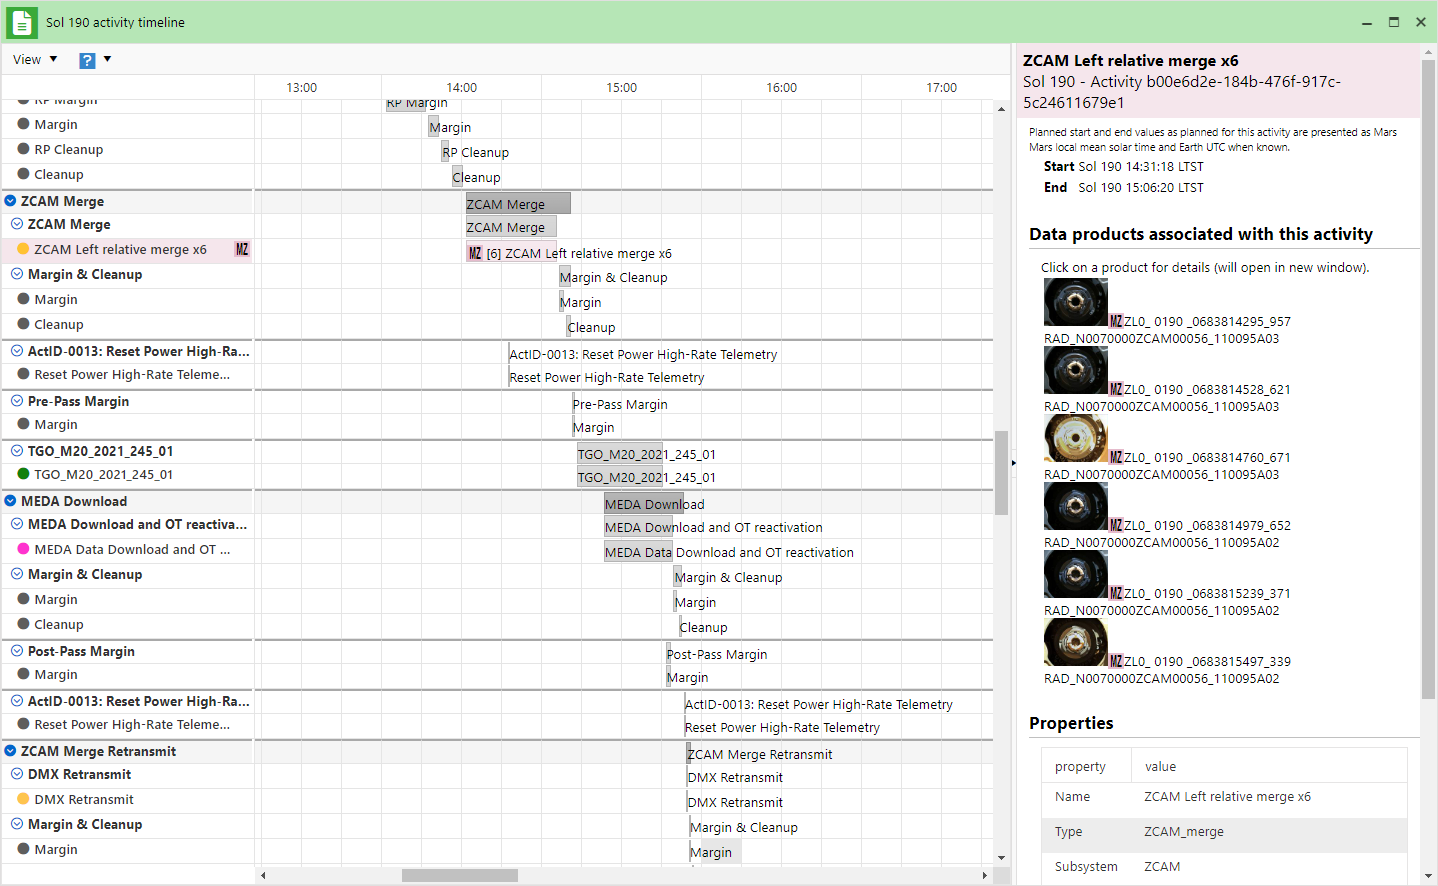
When data products can be mapped to a particular activity, the activity background color is highlighted and an instrument icon is added. For example, in the image above, Navcam and Mastcam-Z data products have been mapped to two of the activities. Clicking on either the activity name in the left-hand column or the activity entry in the grid will bring up relevant information in the right-hand detail pane. In the image below, we see the timeline with merge sets, activity groups, and activities listed in the left-hand column, the timeline grid in the middle, and activity details on the right-hand side. You can resize the detail area by dragging the vertical divider between the timeline grid and the detail area. Clicking on a data product in the activity details will open a detail window with that product.
Not all data products can be related to their source activities. The ability to make matches is restricted to unpublished metadata on the project level. We are collaborating with the science team to improve the matching.
What do all of the activity colors mean?
You might have noticed that each activity has a solid circle beside the name. Colors shown are those used in the science team planning tool. We don't currently have a table of colors and their meaning, but we are working on it.
MISSION SPECIFIC
The Curiosity Rover timeline shows planned activities grouped by their activity type, shown in alphabetical order on the left side of the timeline. Activities without an activity type are grouped at the top of the timeline in the first row.
Individual activities appear on the right side of the timeline in time order. You can hover over an activity to see the full name. Activities outlined in red are associated with one or more data products. Click on an activity to see the details.
Time values in the timeline
The MSL plan timeline shows the planned activity start and end times in Earth UTC. As mentioned above, these times are when activities were expected to run and may not reflect an actual completed activity on Mars.
Moving through the timeline
Scroll horizontally and vertically through the timeline to view activities. Use your mouse wheel to scroll vertically (your cursor must be over the timeline grid and not over the left-hand column of titles).
Accessing details and related data
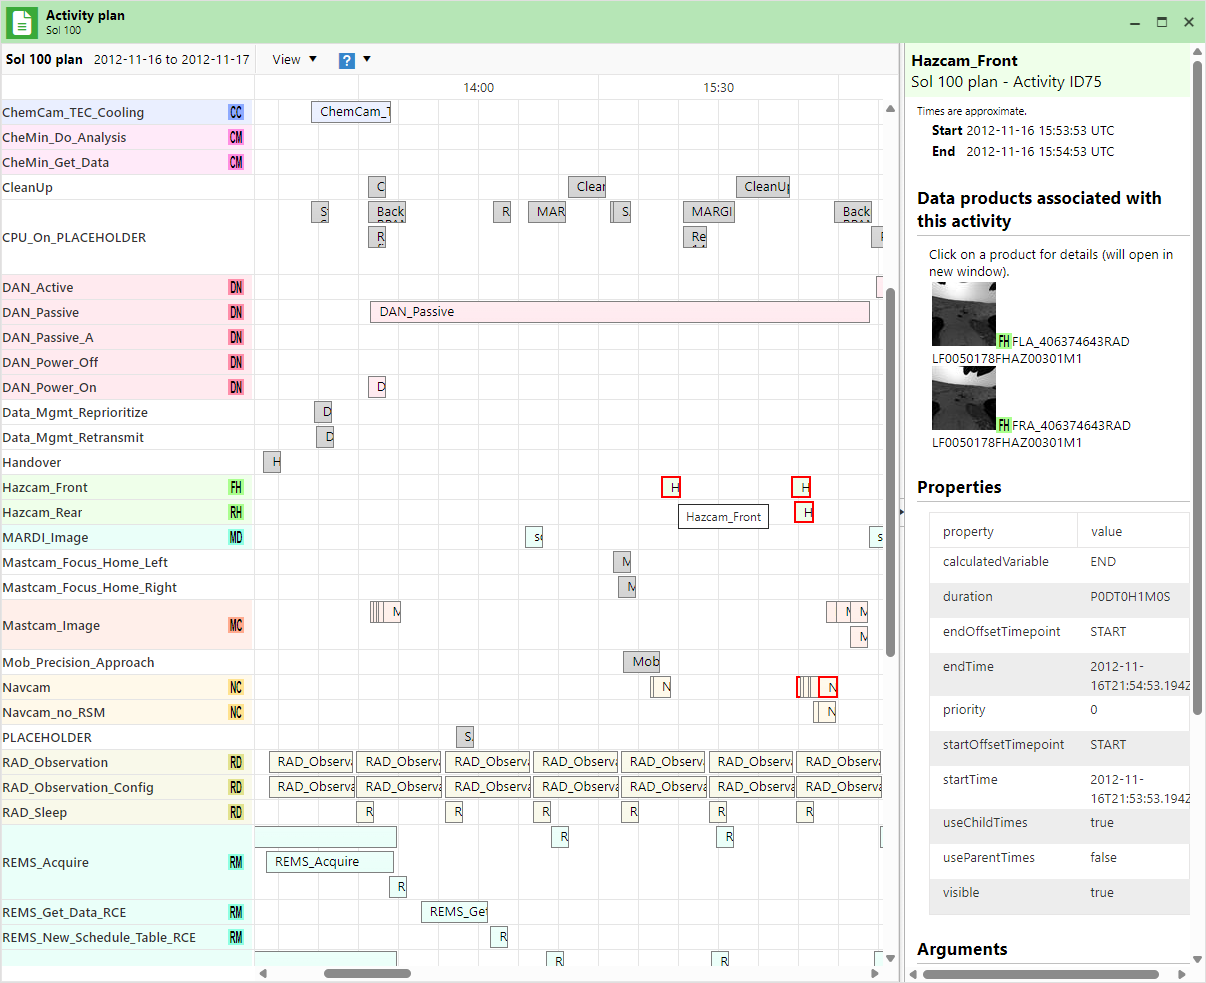
When data products can be mapped to a particular activity, the activity is outlined in red. background color is highlighted and an instrument icon is added. For example, in the image below, Hazcam and Navcam data products have been mapped to some of the activities (outlined in red). Clicking on the activity in the timeline grid will bring up relevant information in the right-hand detail pane.You can resize the detail area by dragging the vertical divider between the timeline grid and the detail area. Clicking on a data product in the activity details will open a detail window with that product.
Not all data products can be related to their source activities. The ability to make matches is restricted to unpublished metadata on the project level. We are collaborating with the science team to improve the matching.
What do all of the activity background colors mean?
The background of activity types and individual activities have a color background when an activity type is associated with a particular instrument. Don't be misled into thinking a color background indicates a link to data—those activities have a red outline. Also be aware that activities without an activity type (they appear in the top row of the timeline) may be related to a specific instrument, but they do not have a color background.
see also